

Graph information
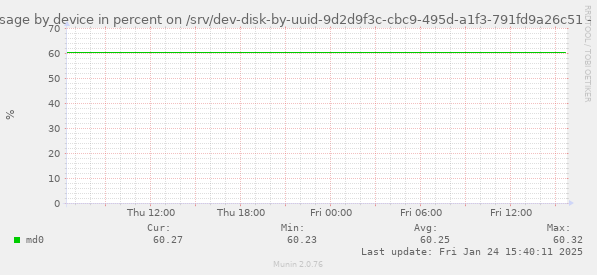
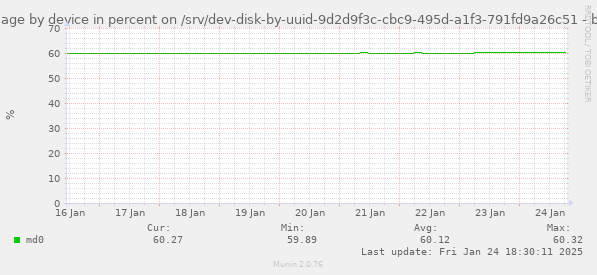
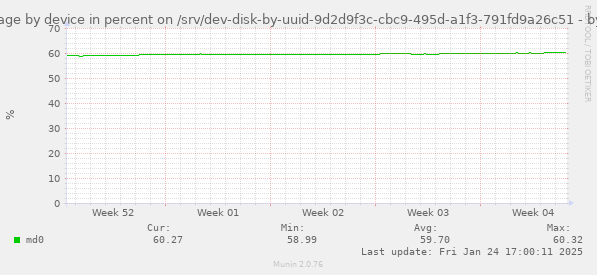
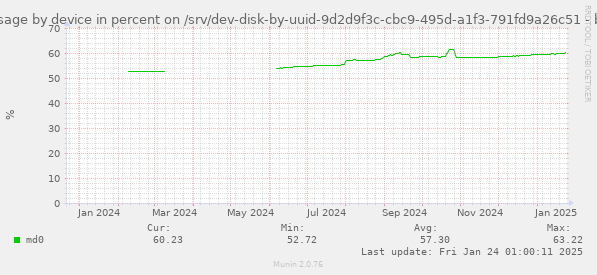
This graph shows percentage used by btrfs on every device. Maesured in percentage of device capacity.
| Field | Internal name | Type | Warning | Critical | Info |
|---|---|---|---|---|---|
| md0 | btrfs_percent_9d2d9f3c_cbc9_495d_a1f3_791fd9a26c51_1 | gauge | 95 | 98 |


This graph shows percentage used by btrfs on every device. Maesured in percentage of device capacity.
| Field | Internal name | Type | Warning | Critical | Info |
|---|---|---|---|---|---|
| md0 | btrfs_percent_9d2d9f3c_cbc9_495d_a1f3_791fd9a26c51_1 | gauge | 95 | 98 |