Graph information
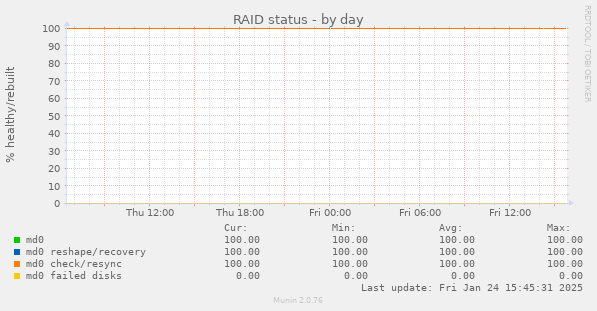
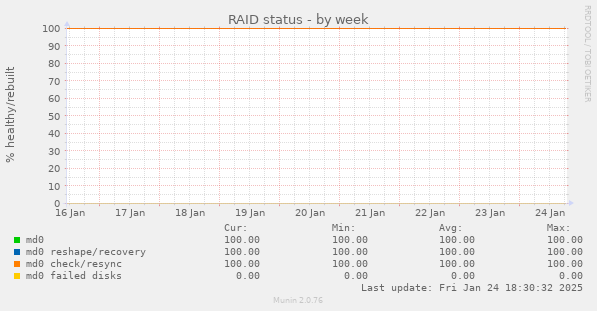
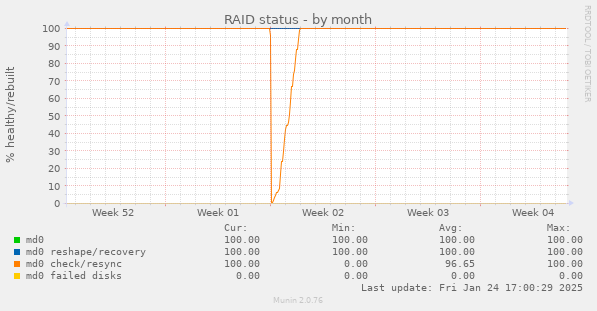
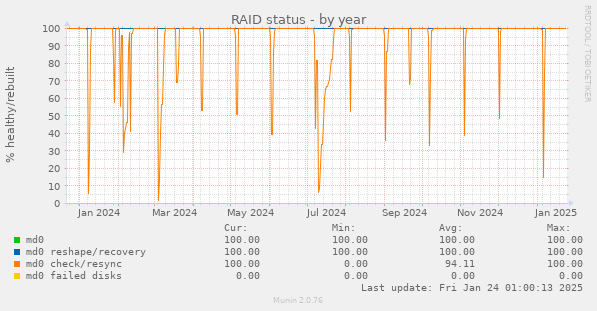
This graph monitors RAID disk health. Values are percentage of healthy drives in each raid group. Degraded devices are marked Critical.
| Field | Internal name | Type | Warning | Critical | Info |
|---|---|---|---|---|---|
| md0 | md0 | gauge | 98: | raid10 sdd[3] sdb[1] sdc[2] sda[0] | |
| md0 reshape/recovery | md0_rebuild | gauge | 98: | idle | |
| md0 check/resync | md0_check | gauge | idle | ||
| md0 failed disks | md0_failed | gauge | 0:0 | idle |
Zooming is very easy, it's done in 3 clicks (regular clicks, no drag&drop):
- Click to define the start of zoom.
- Click to define the ending of zoom.
- Refresh.
You can use the interactive form too.